- India
- International
Friday, Apr 26, 2024
Journalism of Courage
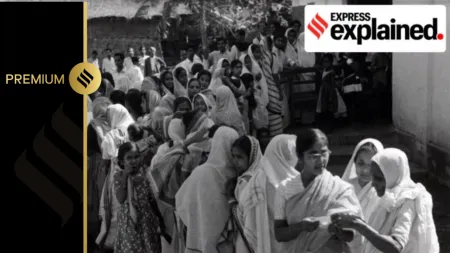
 What stands out is the fact that in the last two financial years in Uttar Pradesh, food price inflation has been significantly above the national average. (Express File Photo)
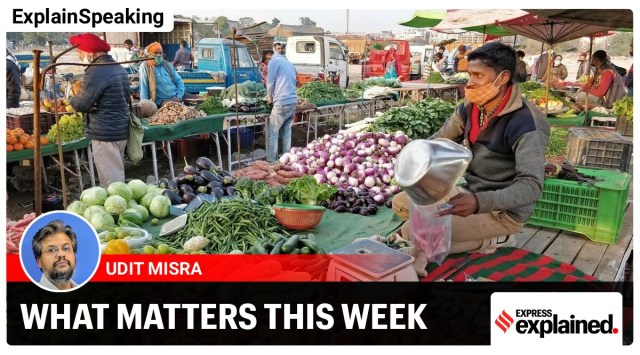
ExplainSpeaking-Economy is a weekly newsletter by Udit Misra, delivered in your inbox every Monday morning. Click here to subscribe
Dear Readers,
Last week we reviewed how the five poll-bound states — Uttar Pradesh, Goa, Punjab, Uttarakhand and Manipur — had performed in terms of per capita Net State Domestic Product, per capita incomes growth, and employment levels over the past five years. We looked at these variables because weak economic growth, equally feeble growth in per capita incomes, and worsening levels of employment distress have been some of the biggest worries at the national level.
This week we will look at two more closely-related variables — inflation rate and the wage rate. Fast-rising prices, in particular, have been a matter of concern over the past two years.
The data is sourced from the Reserve Bank of India’s “Handbook of Statistics on Indian States 2020-21”, which was released at the end of November 2021. However, even this RBI report could not provide data for all the five states in question, at least not on all variables. Still, there is enough data to provide a reasonably cogent picture of how residents of different states faired on inflation and daily wage rates.
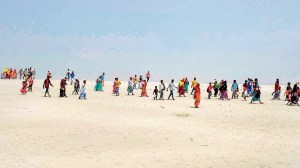
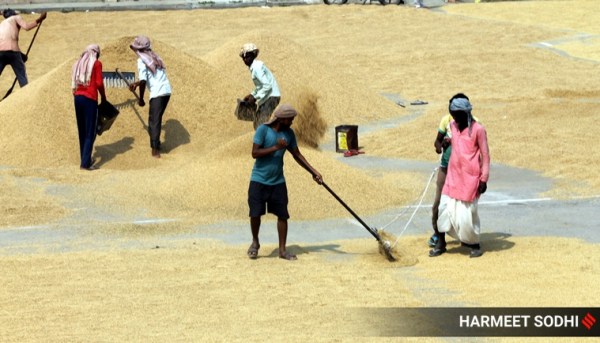 Daily wage labourers spread paddy crop for drying at a grain market in Patiala, Punjab. (Express file photo by Harmeet Sodhi)
Before we get started, it is important to understand that while you commonly come across a single rate of inflation for the whole country or a single daily wage rate for India, the fact is that these rates differ across different states, depending on demand and supply variations. For instance, if Punjab is deficient in agricultural labourers while being far more productive than the neighbouring Uttar Pradesh, then it would stand to reason that the daily wage rate for agricultural labourers in Punjab would be higher than what prevails in UP. Similarly, different factors — ranging from unseasonal rains reducing the supply of a particular vegetable to a state government raising taxes on the price of petrol — affect retail inflation levels.

Each Table provides data from 2014-15 to 2020-21 for each state as well as the all-India average. The crucial year in every chart, of course, is 2017-18 because it neatly coincides with the start of the existing state government’s term.
#1 Retail inflation
Retail inflation refers to the inflation rate that is experienced at the level of consumers. It is arrived at by using the Consumer Price Index (CPI). If the inflation rate is 5% in a particular year then it means that residents of that state have had to spend 5% more money to buy the same quantity as against the previous year.
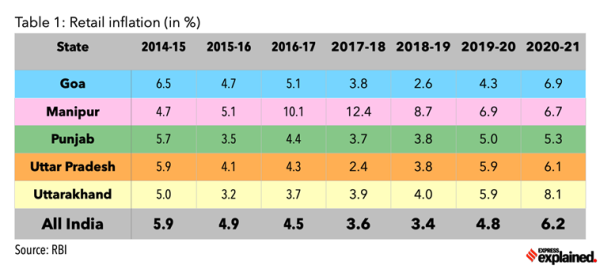
Goa: As in the past, the headline retail inflation rate in the state has hovered around the national average. Crucially, however, it has touched almost 7% during the fourth year of the ongoing five-year term. But this was also the year when the Covid pandemic created the most disruption in supply chains.
Manipur: It is one of the states which has suffered a very high retail inflation rate; it is easily the state (among the five considered here) facing the highest rates of general retail inflation. The RBI’s comfort zone is between 2% and 6%. But in Manipur retail inflation has stayed above that range right through the past four years. It is also important to note that the spike in the inflation rate started in the last year of the previous government’s term (i.e. 2016-17).
Punjab: The inflation rate in the state stayed marginally above the national average since 2014-15 but in the last financial year it managed to pull back the headline number below the national average.
Uttar Pradesh: Barring just one year (2019-20), the headline inflation rate in UP has stayed below the national average since the start of the current government’s term.
Uttarakhand: Since 2015-16, the rate at which overall prices rise (i.e. the headline inflation rate) has been rising with each passing year in Uttarakhand. Unsurprisingly, it has stayed above the national average since 2017.
#2 Food price Inflation
Prices of food and beverages account for almost 46% of all retail inflation. The price rise in this category is the most important factor shaping people’s expectation of future inflation rate and that, in turn, affects their economic behaviour. Moreover, while inflation by definition is regressive — that is, it hurts the poor more than the rich — food price inflation is particularly so because the poor spend a higher proportion of their income on food articles. As such, the higher the food inflation rate in a state the worse off its poor population would have been.
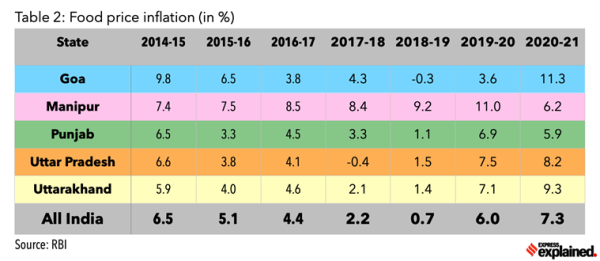
Goa: The state has seen massive swings in food price inflation but, crucially, food prices rose by over 11 per cent in 2020-21 — far above an already high national average.
Manipur: The data shows that the state has had high food inflation every single year but this rate has almost halved in the last financial year, thus finally falling below the national average.
Punjab: After staying slightly higher than the national average in the first three years of the current term, food price inflation decelerated to be below the national average.
Uttar Pradesh: What stands out is the fact that in the last two financial years, food price inflation has been significantly above the national average.
Uttarakhand: Much like UP, Uttarakhand, too, has been unable to contain food prices since 2019.
#3 Fuel price inflation
Fuel and light prices account for just 6% of the overall retail inflation but a spike in fuel prices is politically sensitive not only because of its direct impact but also because it indirectly makes a whole host of goods and services costlier by making transportation costlier.
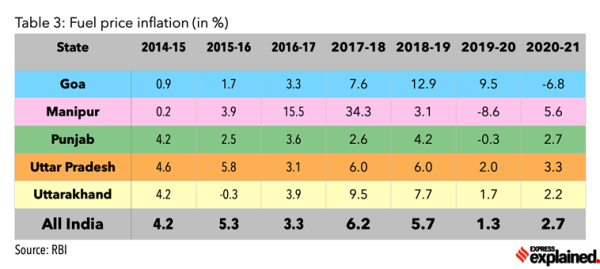
Goa: Since the start of 2017, fuel price inflation spiked quite remarkably in Goa. But in the last financial year, the state witnessed a deflation — that is, the absolute prices fell — in fuel and light prices.
Manipur: Fuel prices have varied from an inflation rate of 34.3% in 2017-18 to a deflation in 2019-20. But in 2020-21, it was almost double the national average rate.
Uttar Pradesh: Fuel price inflation has stayed close to the national average, although it has been above it more often than not in recent years.
Uttarakhand: Over the past two years, the state has been able to contain the year-on-year spike in fuel prices that it witnessed in the first two years of the current government’s term.
#4 Average daily wage rate for agricultural labourers
The flip side of inflation in prices is the rise in wage rates, especially for those segments of the society where the bulk of the population works. Table 4 details the average daily wage rate for agricultural labourers in rural areas of the concerned state. This — and the next data as well — are crucial metrics given the aggravating farm distress in rural India over the past five years.
Unfortunately, this data is not available for three of the five states that go to polls next month but crucially it does provide the data for two of the most populous states of the five.

The first thing to notice is that Punjab’s wage rates are not only higher than UP’s but also higher than the national average. But, if one looks at the year-on-year change in these wage rates, Punjab shows meagre increases — not just lower than UP but also lower than the retail inflation in the state.
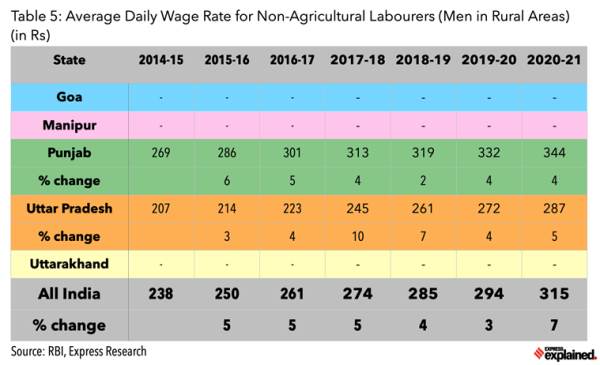
#5 Average daily wage rate for non-agricultural labourers
When one considers the non-agricultural wage rate, the story is largely the same. Punjab’s rate is higher than the national average and the UP rate. However, for the most part, the annual rate of change is a tad lower than UP’s and Punjab’s own retail inflation.
UP’s rate in 2020-21 was what Punjab had in 2015-16.
#6 Average daily wage rate for construction workers
This is another key variable as it captures the wage rates in a sector — construction — which often soaks up a lot of excess labour from rural areas. Because construction projects, often in urban areas, are more rewarding than more profitable than either agriculture or any other non-farm rural enterprise, one finds daily wage rates are higher here.
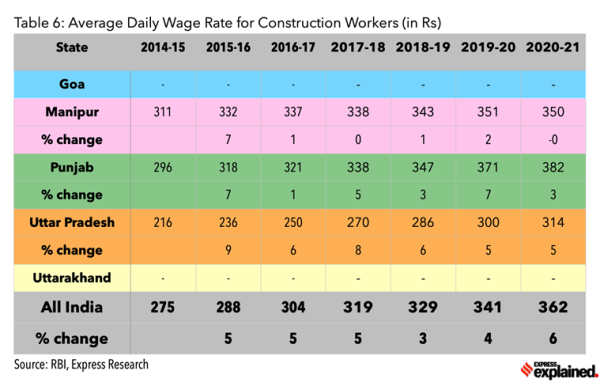
It is interesting to note that at the start of 2017-18, Punjab and Manipur had exactly the same wage rate for construction work but over the next four years Punjab pulled ahead while Manipur has witnessed a near stagnation in wage rates over the past five years. And, while UP is the last in absolute terms, it has witnessed growth rates better than the national average in most years.
Summary: We have already seen how many of these states have struggled to match the national average when it comes to growing per capita incomes. At the same time, they have also been witnessing a secular decline in the total number of people with jobs. To make matters worse, residents of these poll-bound states have also been facing higher than (national) average rates of inflation, especially food inflation.
Please keep sharing your thoughts and queries at udit.misra@expressindia.com
Stay masked and stay safe.


Amidst polling in the state in the phase 2 of the Lok Sabha elections, Karnataka's Chief Electoral Officer (CEO) Friday said a case has been booked against BJP’s sitting MP and Bangalore South candidate Tejasvi Surya for “posting a video in X (formerly Twitter) handle and soliciting votes on the ground of religion.”